Between January and April 2026, diesel prices rose 99% in New Zealand and 71% in Australia.
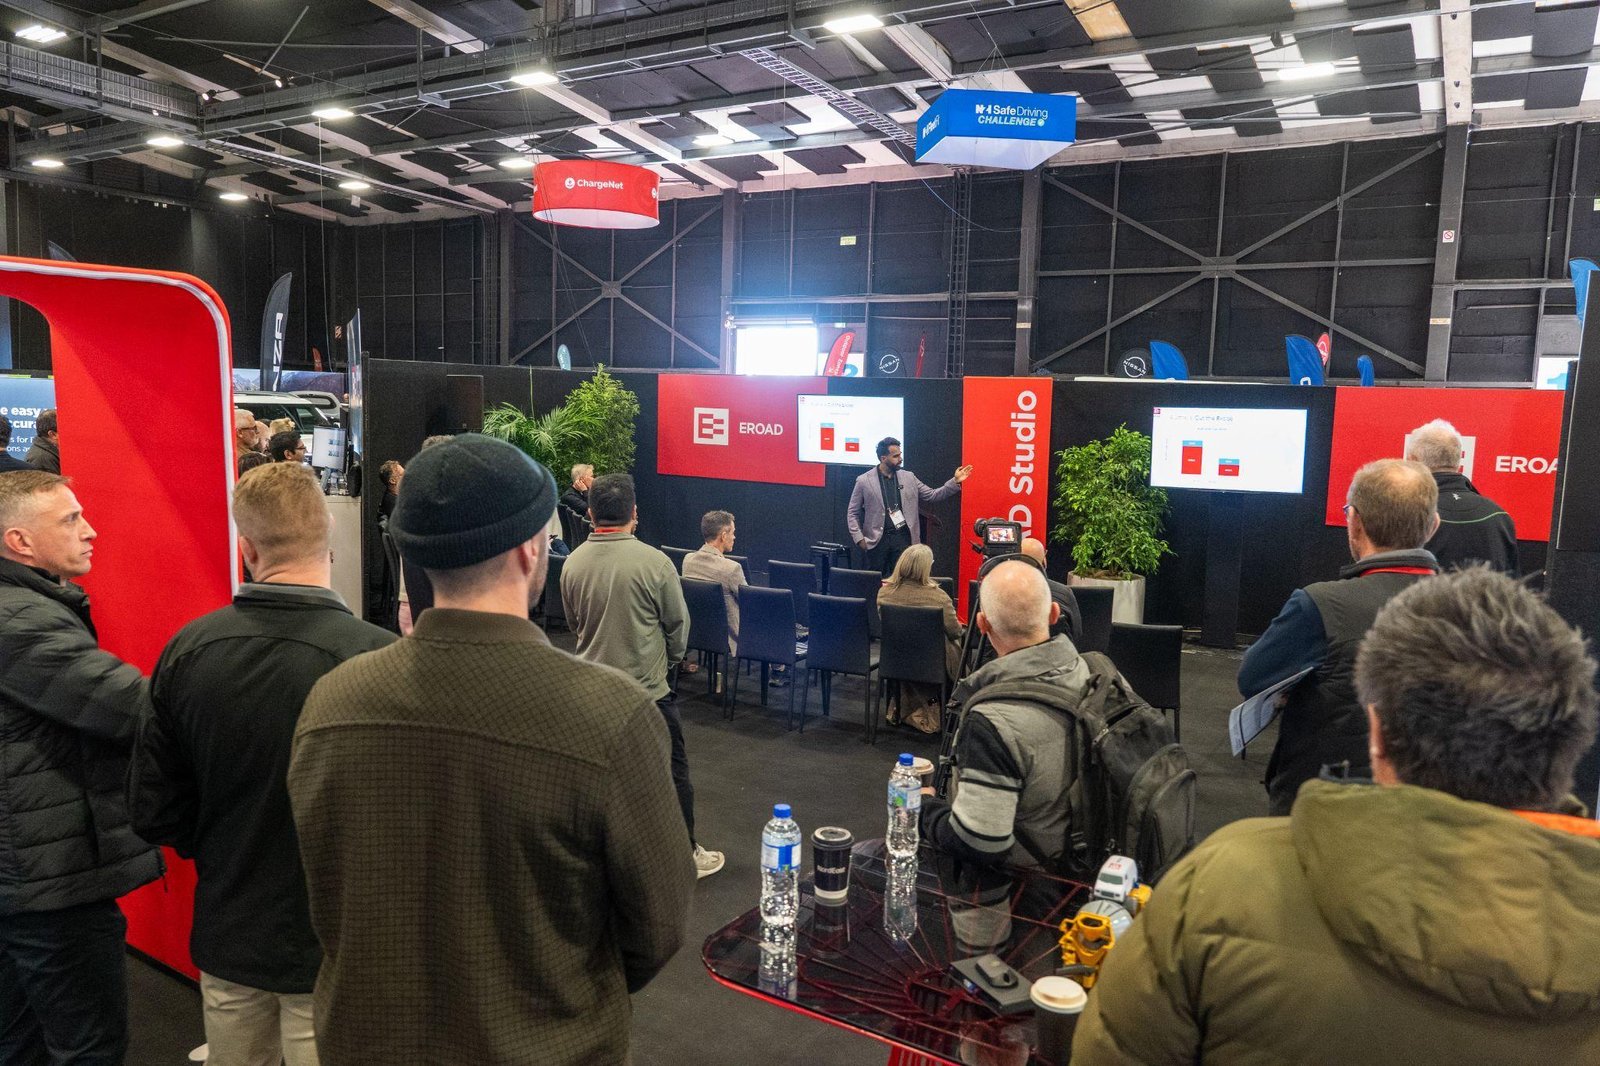
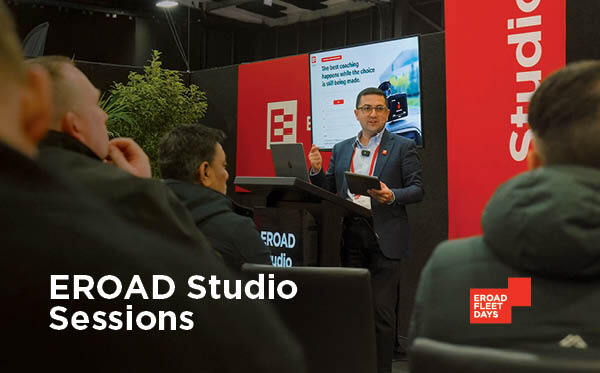
Fuel is one of a fleet’s biggest operating costs, and this year it was also one of the hardest to predict. In this 10-minute Studio session, Akshaya Kumar looks past the price at the pump and focuses on what fleets can control: how efficiently their vehicles and drivers use fuel.
“Fuel prices have been very volatile this year, but your strategy to fuel management shouldn’t be.”
- Akshaya Kumar, Product Line Manager, EROAD
What’s covered:
- Two countries, two responses. Australia cut fuel excise, while New Zealand focused on securing supply. RUC data suggests New Zealand’s economic activity held up through the crisis.
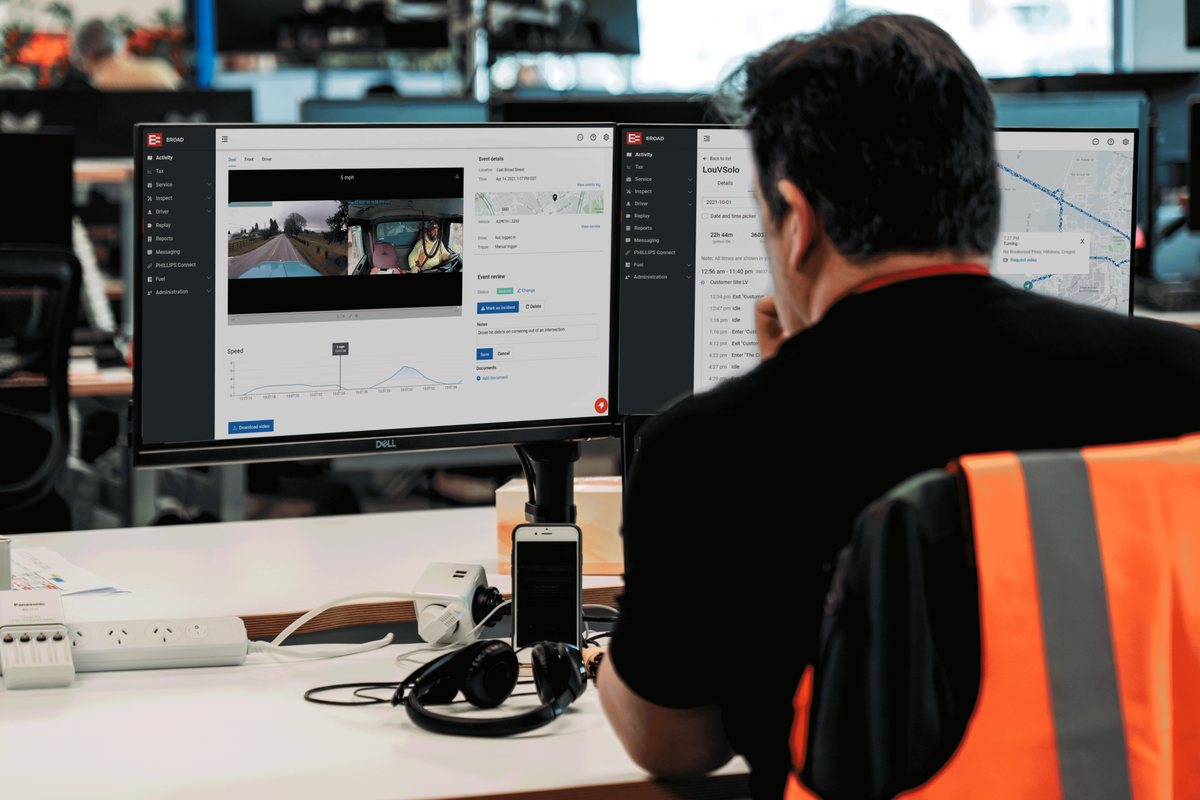
- Seeing where your fuel goes. The MyEROAD fuel efficiency report compares each vehicle’s weekly fuel economy with benchmarks from EROAD data. Fuel card transactions sit in the same view, and the integration is now available in Australia as well as New Zealand.
- What really wastes fuel. According to the research Akshaya shares, speeding causes 33% of fuel waste and acceleration 25%. Idling is third. Drive Buddy scores every trip, and large fleets whose drivers consistently score five stars can save up to $20 per vehicle per month.
- Why coaching has to be fleet-wide. Fleets with Safe Driver coaching on every vehicle average 4 speeding events a month, compared with 17 for fleets with none. Coaching half the fleet only brings it down to 14.
- The EV horizon. For CAN-connected EVs, MyEROAD is adding estimated driving range alongside state of charge on the map. The range comes straight from the vehicle, so it reflects how the vehicle has been driven recently.
Akshaya also compares a few EROAD colleagues’ fuel economy live, and the reason behind the worst result isn’t the one you’d guess.
“Even if half your fleet has coaching, it doesn’t bring in that safety culture.”
- Akshaya Kumar, Product Line Manager, EROAD
Learn more about EROAD fuel management →
Note: Results referenced in this session are based on EROAD customer data. Results may vary depending on fleet size, vehicle type, driver behaviour and operating conditions.