
Skip to content
Get a Demo
Solutions

Start with the outcome, not the hardware

Safer driving, fewer wasted kilometres, compliance that documents itself, the whole fleet on one screen. EROAD points one platform at the result you are paid on, then keeps the proof as it works.

Three Qube workers laughing beside a Scania prime mover in a container yard
Qube crew beside a Scania prime mover, container yard. The results on this page belong to people like these first.
26,089 units at work nationwide FY26 Annual Report
+6.4% unit growth in FY26 FY26 Annual Report
250 m between position polls on a moving vehicle Ehubo2
The outcomes

Pick the result, not the product

Every chapter below is a result Australian fleets buy EROAD for. Start with the one costing you most. The platform underneath is the same.

Safety

Coached at the wheel, not blamed after it.

Coaching at the wheel, cameras both ways and per driver proof that behaviour is changing.

56%

fewer overspeed events across EROAD's driver pool over four years

EROAD driver data
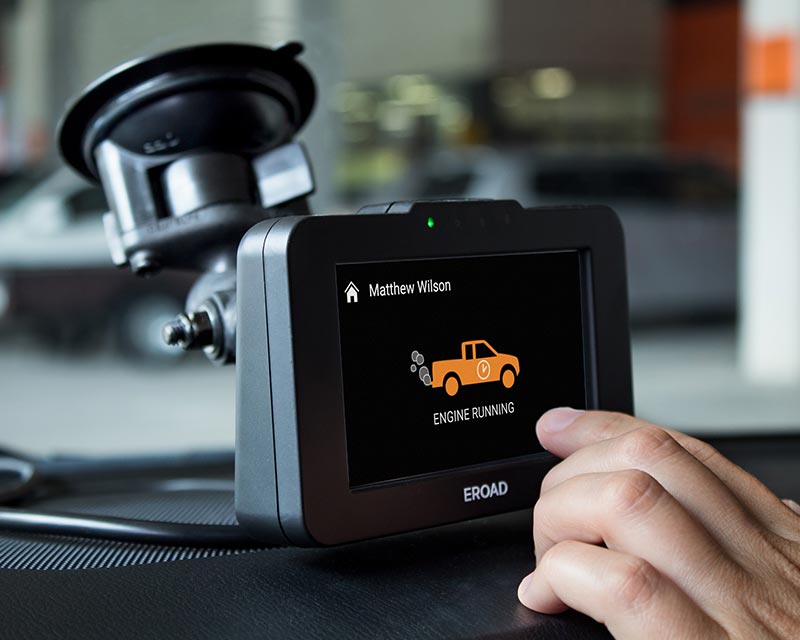
Ehubo2 unit showing an in-cab coaching prompt
The Ehubo2 coaching prompt, in the cab while the driver can still act on it.
The record it leaves
  • Overspeed and behaviour events, per driver
  • HD footage, road facing and driver facing
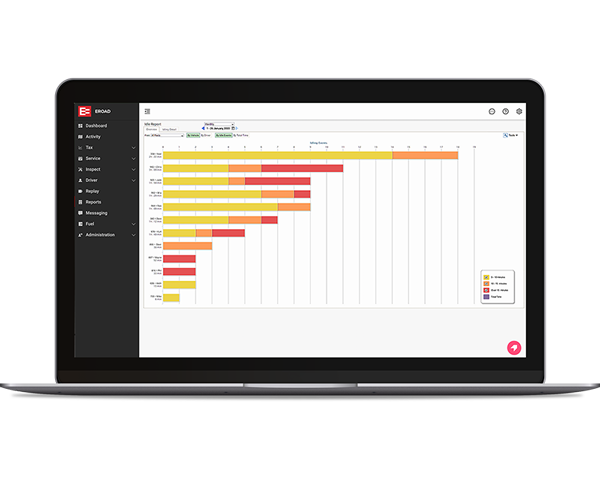
  • Driver scores on the Leaderboard
Efficiency

The cheapest kilometre is the one you never drive.

Fewer wasted kilometres, less idle burn and paperwork that keeps itself.

5 to 15 min

of daily paperwork at Conroy Removals, down from 30 to 40 minutes

Conroy Removals case study
Orange container handler lifting a QUBE container
Container handling at Qube. Idle time and wasted kilometres show up in the same record as the work.
The record it leaves
  • Kilometres, idle time and utilisation by vehicle
  • The day's paperwork, filled as the truck moves
Compliance

The audit answers itself.

Chain of Responsibility, fuel tax credits and FBT, with the evidence collected as the fleet works.

$7,860

of under-claimed fuel tax credits recovered by Pingelly Transport.

Pingelly Transport case study
The record it leaves
  • Off public road travel, logged for the FTC claim
  • Chain of Responsibility evidence as the fleet works
  • FBT records without the paper logbooks: zero FBT paperwork for Life Saving Victoria drivers
Fleet management

The whole fleet, one screen.

Every vehicle, driver, job and service date in one view.

6 months

of records the Ehubo2 holds when a vehicle works beyond coverage

EROAD platform data
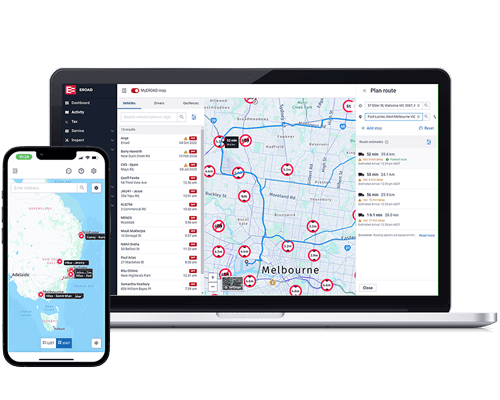
MyEROAD live fleet map on a laptop and phone, showing Melbourne
The MyEROAD live map: the fleet across Melbourne, on the desk and in a pocket.
The record it leaves
  • GPS history for every vehicle and asset
  • Service dates against every vehicle
  • Who drove what, and when
From the fleets
56%
When we started using the tools, because the feedback to the drivers is instantaneous, we saw a huge drop in incidents.

Busfleet Australia has run EROAD for seven years, from the first generation Ehubo to the driver-facing Ehubo2. Across EROAD's driver pool, overspeed events fell 56% over four years.

B Ben FieldBusfleet Australia
How it holds together

One platform beneath it

Up to 85% fewer speeding events per 100 km Ehubo2 against Ehubo1, EROAD data

These are not separate systems. The unit that coaches a driver through the windscreen is the same one logging kilometres for the fuel tax claim, timestamping the evidence for the audit and feeding the live map. Choose the outcome that hurts most; the rest are already being measured.

Where to go from here. The solution pages above each name the exact products and screens that deliver them. If you would rather start from your industry, both routes lead to the same platform.

Name the result. We will show it running.

Talk to the Australian team about what your fleet has to prove this year, and see the screens that already prove it for fleets like yours.