One platform, every kind of work.
The record each industry has to keep, kept for it.
Chain of Responsibility
The record your industry has to keep
See compliance
Choose the right solution for your fleet.
The outcome first, then the kit that delivers it.

Explore the full range of EROAD products.
Each range opens on the page that compares it.
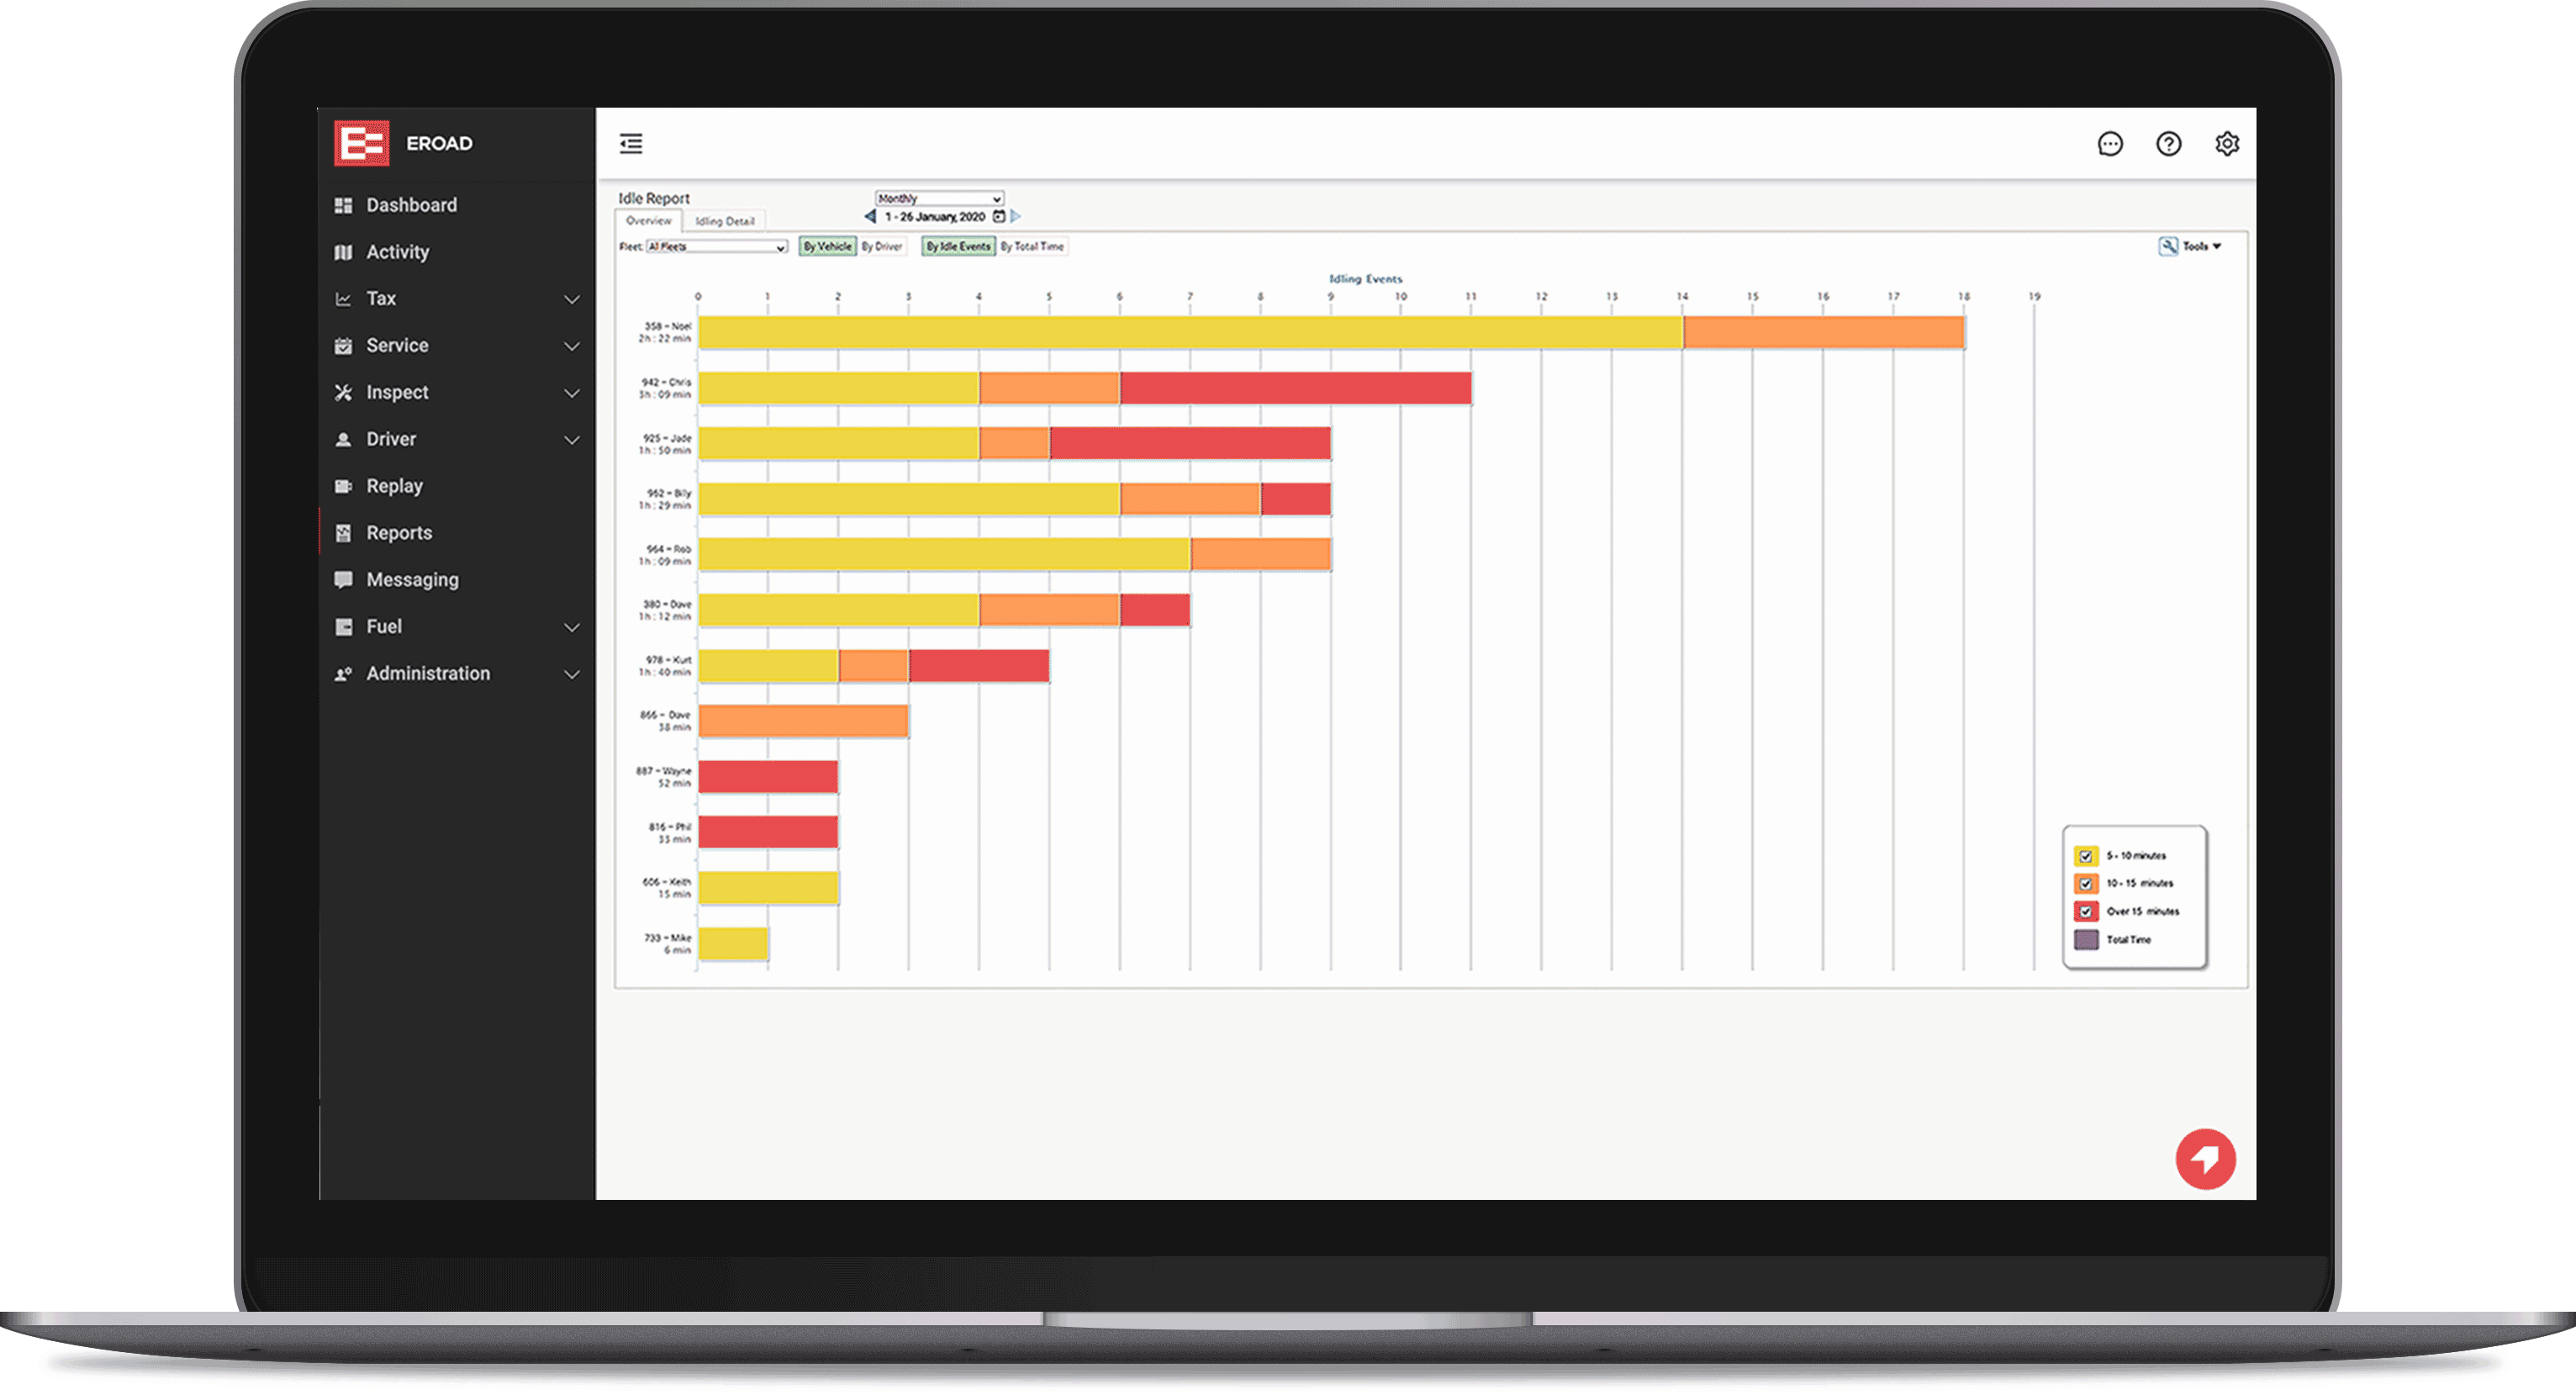
Engines left idling unnecessarily will burn fuel and add wear. Idle reports in MyEROAD show average and total idle time for each vehicle and piece of plant, so you can identify any unproductive idling.
Idling isn't always easy to spot on the fuel bill. Idle reports put a figure on it for every vehicle, so you know where to focus and can see whether the changes you make are working.
The vehicles idling the most stand out straight away. Keep an eye on the report over time and you'll catch trends and exceptions too, like the odd vehicle whose idling suddenly jumps.
That loader left running all morning in the yard? With an Etrack G70 fitted, its idle time shows up in MyEROAD alongside the rest of the fleet.
The report won't switch an engine off. That's still up to whoever's in the seat. Get the idle hours down, though, and you're buying less fuel for the same work.
The figure comes from EROAD customers' fleets. It leaves out productive idling, the kind needed to run compressors, cranes and other auxiliary equipment.
Source: EROAD study


Every vehicle and asset that entered a site in a date range, with running time and any auxiliary equipment run time.
It rolls utilisation, idling, site visits and speed into one report.
Idle time is still engine time, and MyEROAD Fleet Maintenance can schedule servicing by engine hours.
Book a demo and we'll show you how the idle report works, vehicle by vehicle, and how it fits with the rest of MyEROAD. Looking at your fuel costs more widely? See how EROAD helps with fuel management.