One platform, every kind of work.
The record each industry has to keep, kept for it.
Chain of Responsibility
The record your industry has to keep
See compliance
Choose the right solution for your fleet.
The outcome first, then the kit that delivers it.

Explore the full range of EROAD products.
Each range opens on the page that compares it.
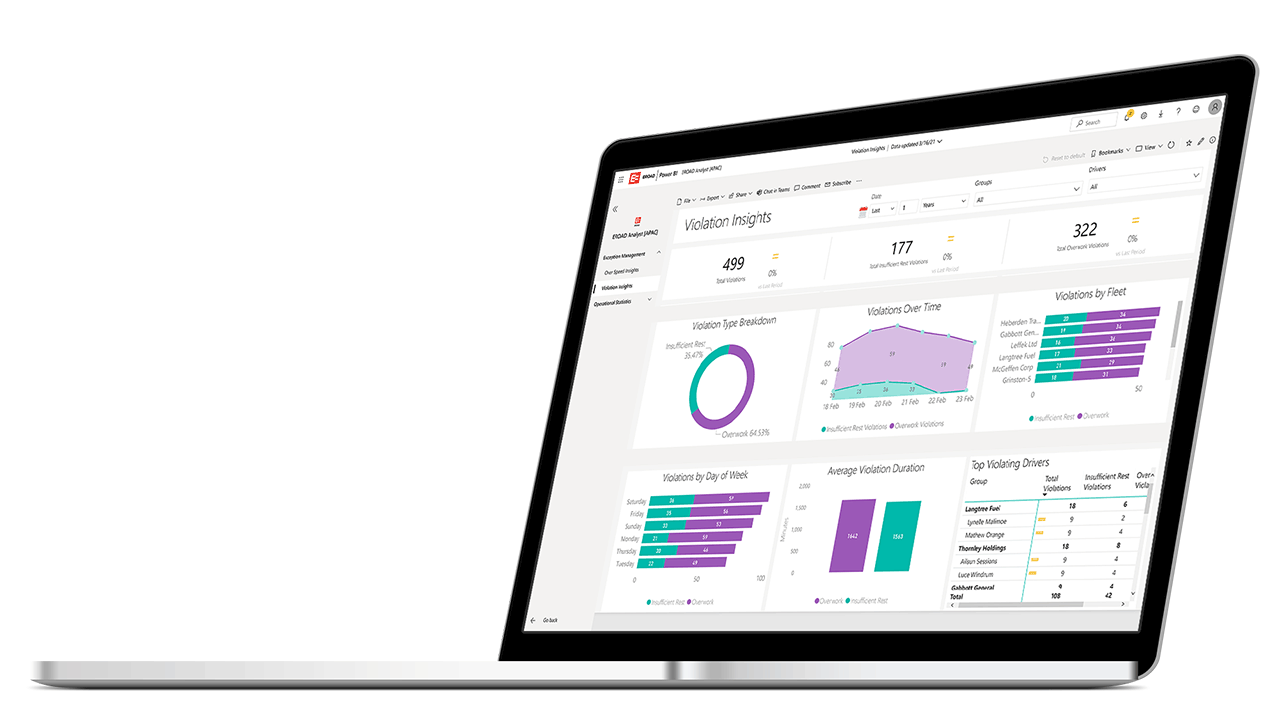
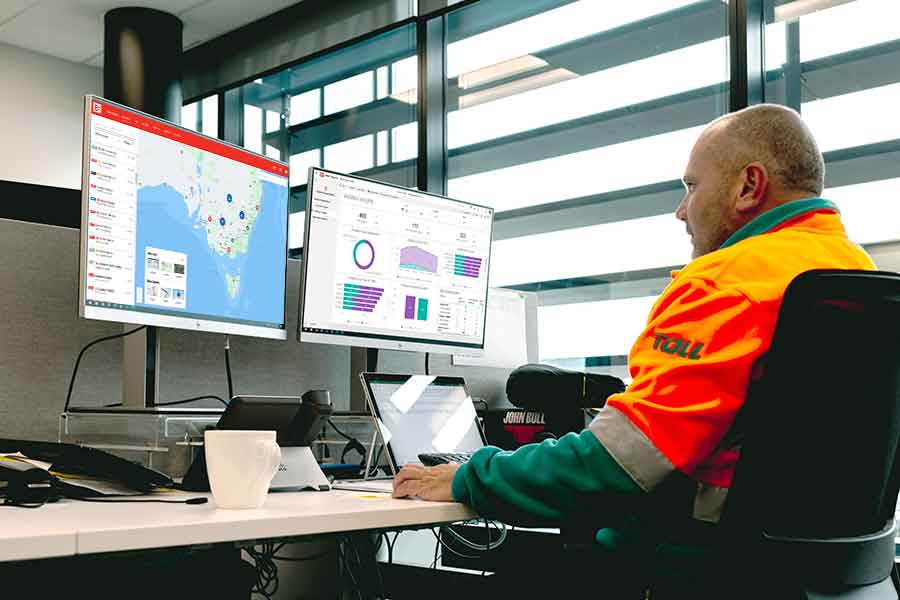
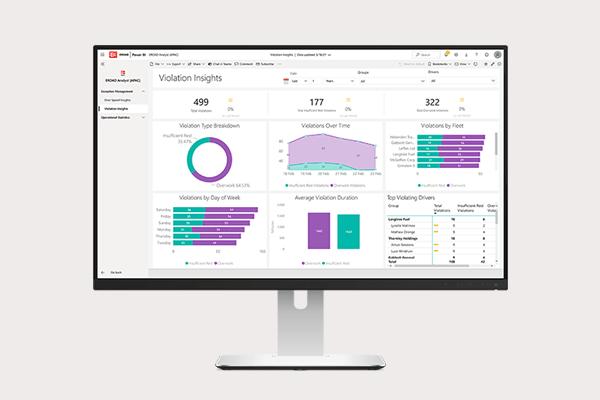
When the board or your CFO asks what's driving fleet costs, the answer is usually split across several systems. EROAD Analyst makes your fleet data available in Snowflake, so your team can combine it with your own finance, payroll and maintenance data and report on it in Power BI, Tableau or Excel.
Operational fleet management platforms are designed for real-time visibility, and day-to-day activity.
Strategic decisions and initiatives need a platform that’s capable of analysing data from the last 3 years, not the last 3 days. And one that can pull data from multiple systems.
EROAD Analyst gives you that. Historical data is stored in Snowflake and refreshed daily. No expensive APIs or manual data retrieval processes.
Why did costs change this quarter? Which vehicles are due for replacement, and what did that project actually cost to deliver? Answering questions like these means putting your fleet performance data next to your finance figures, and Analyst lets you do that in the tools your team already uses.
Driver behaviour and speed events across the fleet, and which way they’re heading.
Which vehicles and assets earn their keep, and which mostly sit idle? See how each one is used over months, so one busy week doesn't skew the picture.
Total cost of ownership for each vehicle, so you can spot the ones starting to cost too much to run.

When the board asks about emissions, your distance and fuel records are there to work from.
Check how well your fleet sticks to company policy over time.

Fleet data can sit in the same report as your ERP, payroll and finance data.
Snowflake stores your full MyEROAD history, from trips and driver behaviour to fuel use and utilisation.
From there, your data flows into your own custom dashboards in PowerBI, Tableau or Excel - you can even combine it with data from other systems - ERP, Finance, HR, or workshop management.
Below are examples of how our customers are using Analyst today.
1. Driver behaviour profiles
Build a picture of overall driver performance beyond simply speed and harsh events.
2. Abnormal fuel usage
Grouping fuel insights and understanding what abnormal looks like for your fleet - not based on a random benchmark.
3. Asset utilisation and efficiency
Effective usage of assets goes beyond how long they were run for.
4. Detailed cost performance
Combine data from multiple systems to get an understanding of cost per kilometre - and what's driving it.
5. Government and regulator reporting
When a regulator or government contract demands reporting in a specific format, with specific datapoints - you need the flexibility to build it the way they want it.
Getting fleet data into your own reporting tools usually means running an integration project first. Analyst skips that step: we manage it for you, and your MyEROAD data lands in Snowflake ready for your team to query.

Documentation and templates mean you’re not starting from scratch.
Finding and preparing data is slow, costly work. Analyst takes it off your hands.

Build exactly the reports you need to track the business and spot trends.
Stuck on a query? Our data experts can help.
The latest data, with all the history behind it.
Power BI, Tableau or Excel. If you run your own data warehouse, it connects to that too.
Tell us which metrics matter to your business, and our data experts will work with you to build the reports around them.
With a conversation. We’ll talk through the metrics and data your business needs to keep an eye on, and work out the rest from there.
You don’t have to. If you have business analysts, our data experts can work with them to set up your custom dashboards. If you don’t, we can get you going with quick templates.
Common tools such as Power BI, Tableau and Excel all work. Connect your tool to the data in Snowflake, write a query and build the dashboard or report. You can bring your own data into the same tool, or if your needs are bigger, build your own data warehouse and report from that.
Analyst sits alongside the MyEROAD APIs. They are two different solutions, for two different needs. Analyst refreshes your fleet data in Snowflake daily, some datasets are more frequent - but it isn't real-time. APIs are for real-time operational needs. They're an expensive tool less well-suited to high volume historical data.
If you're unsure what you need, we can help you work out which one suits your needs best.
You can go straight to our data experts, and there’s a data dictionary that explains the tables and how they fit together.
Maybe there's a ten-year contract to price, or a tender that asks for reporting you can't pull together today. Book a demo and we'll show you how you'd tackle it with Analyst.